I have a question (maybe stupid question). How to change the style of an graph from LINE to BAR style? All graphs I've made seems to appear only with LINEs. I need BAR style, like Cacti.
thanks
Article Comments
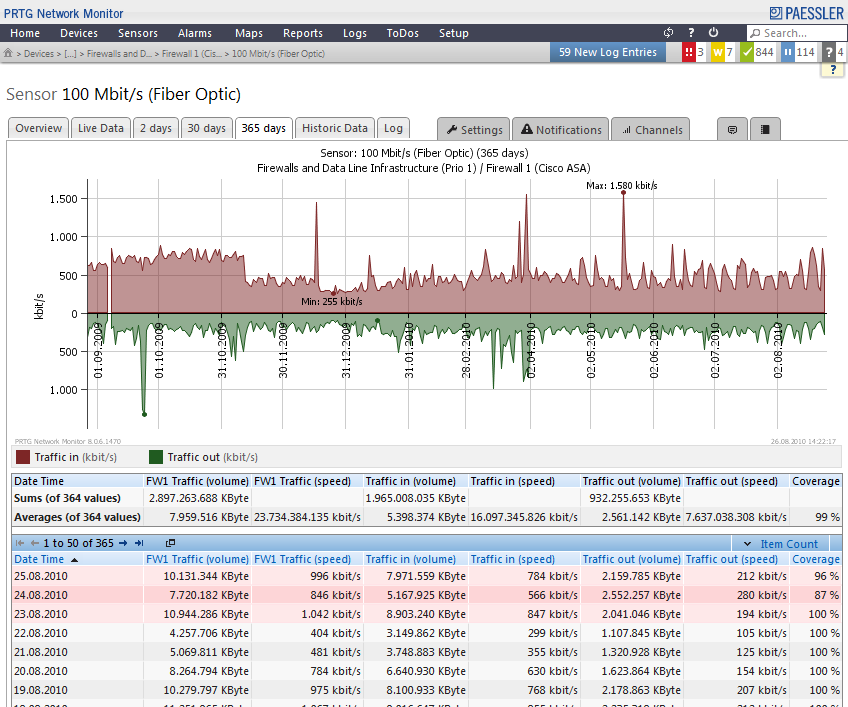
Instead BAR style, can I use AREA graph style like this:
https://media.paessler.com/common/files/screenshots/Bandwidth_monitoring_r2209.png?rand=268990128
Until now all graphs appear with LINE style.
thanks for the help
Jan, 2011 - Permalink
You might want to have a look at the CSVImport tool. As the name suggests it can import CSV files (generated by CSVExport), but it can also get data directly from your PRTG server to make nice graphs.

Jan, 2011 - Permalink
@ujku1977: area graphs can be turned on in the configuration settings, under "Setup -> System Administration -> System & Webiste". You will find the option "Graph Type" under the "Webserver and Website Settings" heading.
Jan, 2011 - Permalink
@Gerard: very interesting tool, bookmarks it.
@Patrick: thanks for your help. My mistake, my version was 7 which doesn't have "Graph Type" option or maybe I'm not able to find that option on ver.7. I removed and install ver.8, really nice and fast. For the moment I'm interested on only 6 sensors and the Report option, which is better from all programs I've tested before.
Best Regards
Jan, 2011 - Permalink

Hello,
I'm afraid Bar graphs are not available in PRTG.
Best Regards.
Jan, 2011 - Permalink