Hi, I want to be able to create an hourly scheduled PDF or html report that can be sent by email, which shows all sensors that have a down status, from the moment the report is created. (so only the current down sensors).
Since the reports seem to be working with tags (and there is no dynamic tagging, which tags down sensors with a down tag for as long as they are down) I see no way of creating such a report with the standard tools/templates.
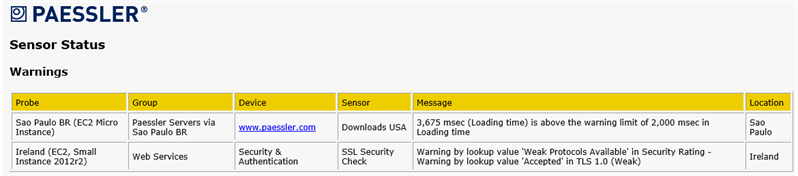
Basically, the overview you see when you click on the red Down status icon from the PRTG main screens top right corner, but then sent as a PDF and/or HTML report by email, following a specific sending schedule.
How do I create this?
Article Comments
This is exactly the overview I want, but per email. Imagine you do not have direct access to your PRTG server on the phone, but do get emails with that content. It does not have to be a report, a map would be fine, as long as I could schedule a PDF or HTML mail to be sent with that content. We need that when we are supporting out of office hours and check quickly if all is well.
Feb, 2018 - Permalink
I understand what you're asking, but I apologize as we do not have this feature in our reporting.
We do have a mobile app for smart devices that can connect to your PRTG environment and give you the same information you get on the web interface.
Feb, 2018 - Permalink
Did you already have a look at the Status2Email tool?
The tool by default reports on Down and Warning sensors, but can be configured using various parameters.
Running this tool as a scheduled task might be the answer you are looking for.
Mar, 2018 - Permalink

This cannot be done with a report. You'd be best to create a map, as there is a table map object for Down sensors that you can link back to the Root level.
This could be accessed by anyone who needs it at anytime.
You can also use this link here as it is a direct link to your current down sensors.
https://<PRTG URL>/tablewithstyles.htm?tableid=sensortable&content=sensors&columns=sensor%2Cprobegroupdevice%2Cstatus%2Cmessage%2Clastvalue%2Cminigraph%2Cpriority%2Cfavorite%2Ccheckbox&tools=pause%2Cacknowledge%2Cfave%2Cprio%2Cscan%2Cdelete%2Cedit&sortby=priority&sortable=true&refreshable=true&tabletitle=AUTO&filters=words%21sensors%2Cobjects%21data-filtername%3D%27id%27%7Cdata-inputname%3D%27id%27%7Cdata-rootid%3D%270%27%7Cdata-onlysensors%3D%270%27%7Cdata-sensors%3D%270%27%7Cdata-hidesensors%3D%27true%27%7Cdata-devices%3D%271%27%7Cdata-groups%3D%271%27%7Cdata-required%3D%27%27%7Cdata-probes%3D%271%27%7Cdata-allownone%3D%271%27%7Cdata-allowone%3D%271%27%7Cdata-allowself%3D%271%27%7Cdata-allowroot%3D%271%27%2Ctags&filter_status=5&_hjax=true&_=1518668589030&id=0&hidezoomlink=true&count=500
Feb, 2018 - Permalink