Can I monitor my NextGen (Mirth) Connect installation with PRTG? What steps do I need to take?
Article Comments
This article applies to PRTG Network Monitor 18 or later
Monitoring NextGen (Mirth) Connect with PRTG
You can monitor your NextGen (Mirth) Connect communication server with the EXE/Script Advanced sensor from PRTG and a custom script. With the custom script, you can create a custom Mirth System Health sensor and a custom Mirth Channel Stats sensor. These sensors allow you to monitor important parameters of the communication server.
Create a New Device
- Create a new device in PRTG with the IP address of the NextGen (Mirth) Connect communication server. We recommend that you use a new device to avoid issues if the Linux credentials change.
- In the device's settings, enter your NextGen (Mirth) Connect username and password under Credentials for Linux/Solaris/Mac OS (SSH/WBEM) Systems.
- Click OK to continue.
Note: You can use a custom device template to automatically add the custom Mirth sensors to your device. See Auto-Discovery via Device Template below.
Monitoring Mirth System Health
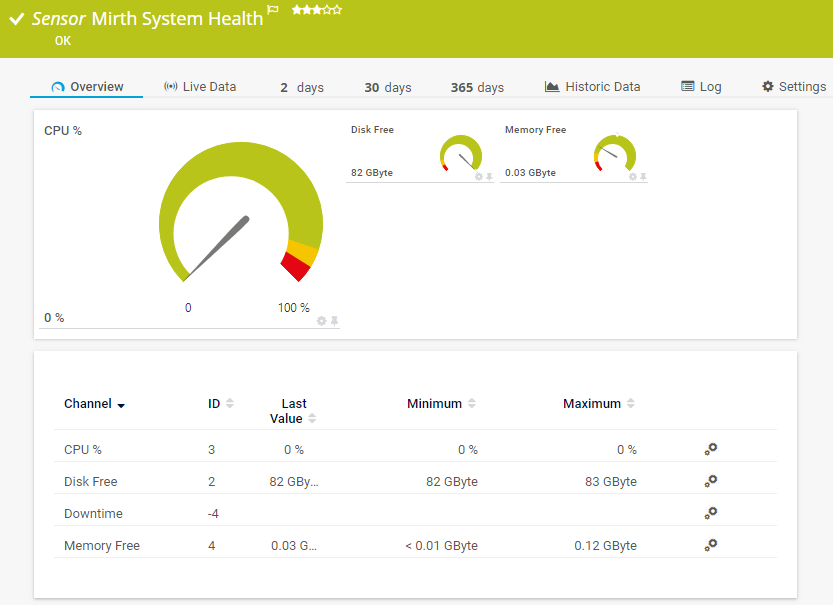
You can monitor system health using the EXE/Script Advanced sensor and our custom script to create a custom Mirth System Health sensor. You can find the script in the PRTG eHealth-NEXTGEN-Connect project on GitLab. With this sensor, you can monitor
- CPU %
- Free Memory
- Free Disk Space
1. Copy the script prtg_mirth.ps1 and save it in the Custom Sensors\EXEXML subfolder of the PRTG program directory.
2. Create a new EXE/Script Advanced sensor.
3. Under EXE/Script select prtg_mirth.ps1.
4. Enter the following under Parameters
prtg_mirth.ps1 <IP/DNS> <port> <%linuxuser> <%linuxpassword> "system"
5. Replace <IP/DNS>, <port>, <username>, and <password>.
6. Click Create to add the sensor.

Click here to enlarge.
Monitoring Individual Interfaces
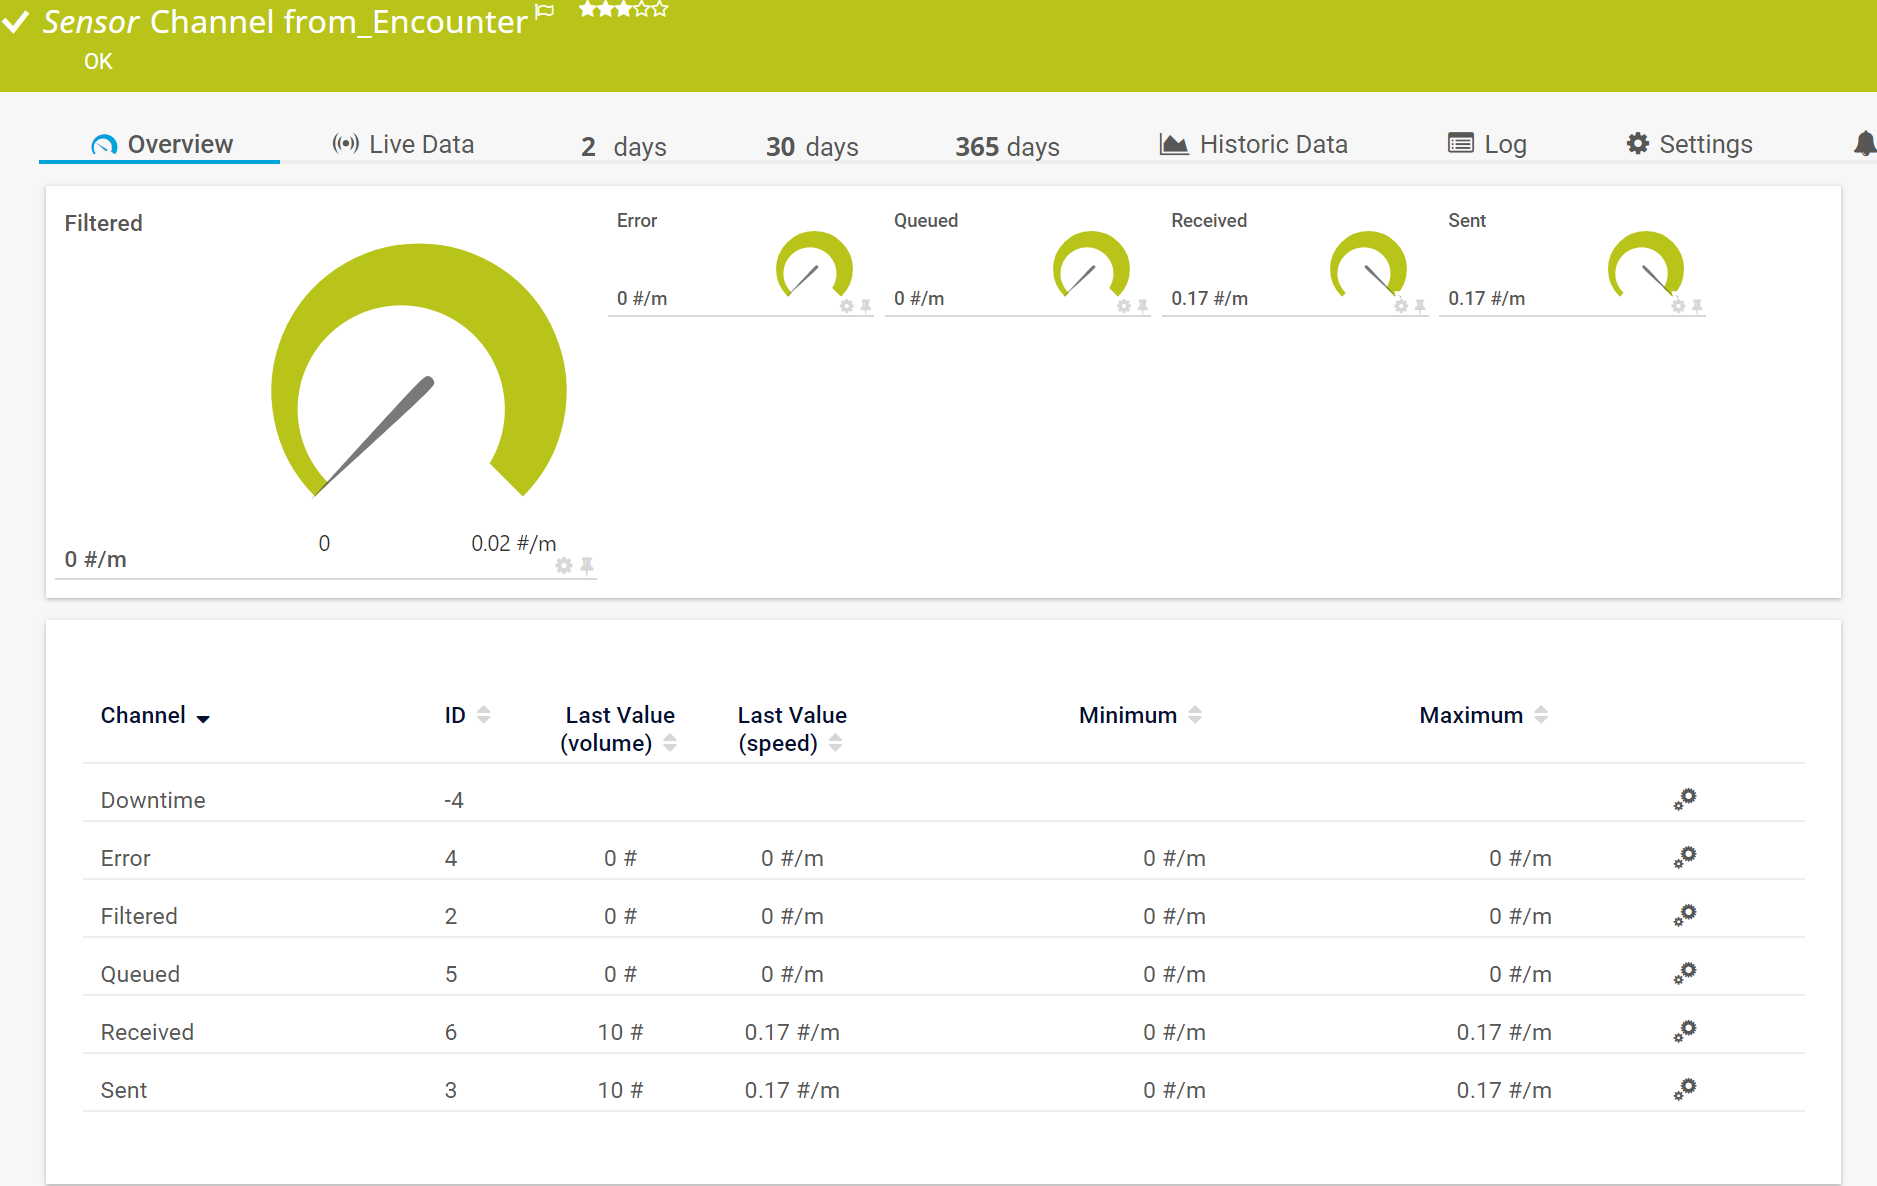
You can also monitor individual interfaces using the EXE/Script Advanced sensor and the same custom script as mentioned above to create a custom Mirth Channel Stats sensor. This sensor monitors the number of sent and received messages as well as faulty and buffered messages of the following channels:
- Received
- Sent
- Filtered
- Error
- Queue
Follow the same steps as with the custom Mirth System Health sensor but under Parameters, enter the following
prtg_mirth.ps1 <IP/DNS> <port> <username> <password> "channel" <channelID>

Click here to enlarge.
Auto-Discovery via Device Template
You can also use a custom device template so that PRTG regularly scans the device and creates sensors for newly added channels from Mirth.
- Copy the prtg_mirth_template.odt from the PRTG eHealth-NEXTGEN-Connect project on GitLab.
- Save it in the \devicetemplates subfolder of the PRTG program directory
- In the device's settings, go to section Device Type.
- Under Sensor Management, select the option Automatic sensor creation using specific device template(s).
- Select the template NEXTGEN (Mirth) Connect.
- Select a Discovery Schedule.
- Click Save to continue.
Debugging
For debugging purposes, you can also add the -Verbose parameter to enable logging to the console.
Aug, 2018 - Permalink
I can generate a support ticket if this is better served by that method? I have inherited this setup, so learning.... This is the error I receive when I run the system check:
XML: The returned XML does not match the expected schema. (code: PE233) -- JSON: The returned JSON does not match the expected structure (Invalid JSON.). (code: PE231)
Mar, 2019 - Permalink
I'm the same error
XML: The returned XML does not match the expected schema. (code: PE233) -- JSON: The returned JSON does not match the expected structure (Invalid JSON.). (code: PE231)
when apply EXE/Script Advanced sensor with prtg_mirth.ps1. How to fixed it?
Jul, 2021 - Permalink
Hello alexlin,
please open a support ticket to "support@paessler.com" and we will continue there.
Thanks!
Jul, 2021 - Permalink

This article applies to PRTG Network Monitor 18 or later
Monitoring NextGen (Mirth) Connect with PRTG
You can monitor your NextGen (Mirth) Connect communication server with the EXE/Script Advanced sensor from PRTG and a custom script. With the custom script, you can create a custom Mirth System Health sensor and a custom Mirth Channel Stats sensor. These sensors allow you to monitor important parameters of the communication server.
Create a New Device
Note: You can use a custom device template to automatically add the custom Mirth sensors to your device. See Auto-Discovery via Device Template below.
Monitoring Mirth System Health
You can monitor system health using the EXE/Script Advanced sensor and our custom script to create a custom Mirth System Health sensor. You can find the script in the PRTG eHealth-NEXTGEN-Connect project on GitLab. With this sensor, you can monitor
1. Copy the script prtg_mirth.ps1 and save it in the Custom Sensors\EXEXML subfolder of the PRTG program directory.
2. Create a new EXE/Script Advanced sensor.
3. Under EXE/Script select prtg_mirth.ps1.
4. Enter the following under Parameters
prtg_mirth.ps1 <IP/DNS> <port> <%linuxuser> <%linuxpassword> "system"5. Replace <IP/DNS>, <port>, <username>, and <password>.
6. Click Create to add the sensor.
Click here to enlarge.
Monitoring Individual Interfaces
You can also monitor individual interfaces using the EXE/Script Advanced sensor and the same custom script as mentioned above to create a custom Mirth Channel Stats sensor. This sensor monitors the number of sent and received messages as well as faulty and buffered messages of the following channels:
Follow the same steps as with the custom Mirth System Health sensor but under Parameters, enter the following
prtg_mirth.ps1 <IP/DNS> <port> <username> <password> "channel" <channelID>Click here to enlarge.
Auto-Discovery via Device Template
You can also use a custom device template so that PRTG regularly scans the device and creates sensors for newly added channels from Mirth.
Debugging
For debugging purposes, you can also add the -Verbose parameter to enable logging to the console.
Aug, 2018 - Permalink