Hello,
We are able to customize graphs after we've created them. This is good! But I don't like to edit my graphs every time I created them! So, how to edit the default system color of the graph without editing channels? I mean, by default, when we create an bandwidth graph, using "Chart Type/Show channels independently (default)" we have these channels:
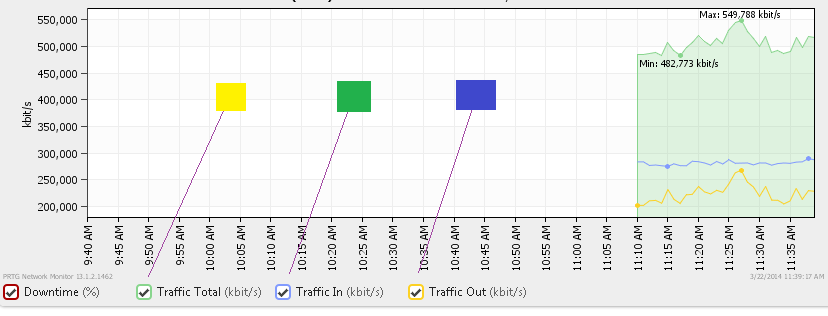
Traffic In - Blue Traffic Out - Yellow/or Orange Traffic Total - Green
What I need is to invert the default colors, on this:
Traffic In - Green Traffic Out - Blue Traffic Total - Yellow/Orange
http://i1210.photobucket.com/albums/cc414/prefix355/Games/chart1_zps884b4dcb.png
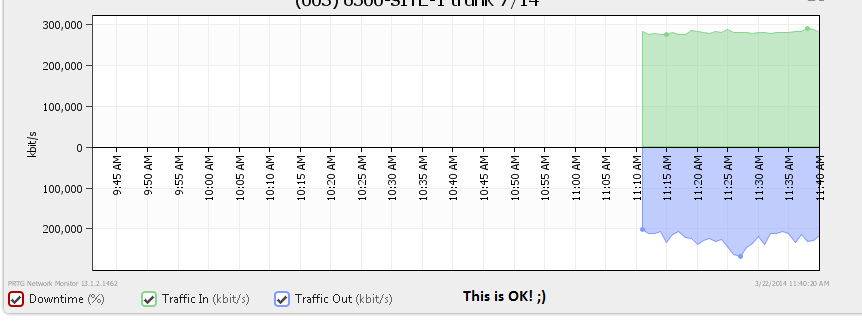
A good example is the option "Show in and out traffic as positive and negative area chart".
http://i1210.photobucket.com/albums/cc414/prefix355/Games/chart2_zps7a8b4705.png
Thank you
Article Comments
Will this functionality be added in a future release? We to would like to change the default colors for channels, and not have to do it for all sensors, as they are created.
Sep, 2016 - Permalink
It probably won't make it's way into PRTG due to the low demand of the feature. Sorry!
Sep, 2016 - Permalink

There is no way to change the lines in the graph by default but if you want to have all of the SNMP traffic sensors have the same colors, you can do this by using multi-edit as mentioned in the other KB article:
https://www.paessler.com/en/topic/56783-color-of-graph
Mar, 2014 - Permalink