As i have 40 Devices (routers) each has different IP and placed in different location and each devices has one interface and each interface has two channels (Download and upload), I want to make aggregation of 40 devices download and upload channel in one graph, Please let me know, how to make this in PRTG network monitoring Ver -8.3. It's the latest generation of Ver-6 but it's difficult to understand. if possible, Please provide me any video link..
It's possible in PRTG Traffic grapher Ver-6 and also it's very simple to make..
Regards
Rasul
Article Comments
Attention: This article is a record of a conversation with the Paessler support team. The information in this conversation is not updated to preserve the historical record. As a result, some of the information or recommendations in this conversation might be out of date.
Hello,
I'm afraid there's currently no video-tutorial on that subject. But to create a sensor that aggregates data/values from several sensors, the Sensor Factory Sensor is the solution:
Once you've added the corresponding devices and sensor's for each of the devices, you can create a Factory Sensor sensor, which can aggregate and perform calculations based on available sensor data based on a channel definition syntax.
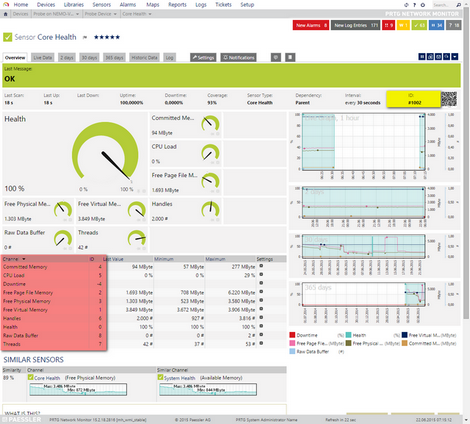
The Channel definition will be based on the Sensor's ID (Highlighted in yellow, top-right corner) and the Channel Numbers (or ID) (center-bottom, highlighted in red) that can be seen within the source Sensor's overview:

Full-resolution Image
Examples Based on the Image Above
Subtraction of Channels
Create a Sensor Factory Sensor to display the "Free Virtual Memory" minus the "Free Physical Memory" and calling it "Channel Subtraction":
#1: Channel Subtraction
Channel(1002,1) - Channel(1002,3)
Sum of Channels
Create a Sensor Factory Sensor to display the sum of the "Free Page File Memory", "Free Physical Memory" and "Free Virtual Memory" (from the image above) and calling it "Sum of memory Channels".
#1: Sum of memory Channels
Channel(1002,2) + Channel(1002,3) + Channel(1002,1)
Display/Combine Channels
Create a Sensor Factory Sensor to display/combine the individual channels "Health" and "CPU Load" with distinct names on a new multi-channel sensor. This is useful when you want a graph that will show you the utilization of various devices within a same channel to compare resource utilization at various servers for example.
#1: Factory CPU Load
Channel(1002,5)

#2: Factory Health
Channel(1002,0)
Add a "Line" to a Graph
Create a Sensor Factory Sensor to display the total traffic from a traffic sensor but additionally display a "limit line" (useful in maps). The color and thickness of the line can be adjusted in the Channel's settings after it's creation.
#1: Total Bandwidth
channel(2120,-1)

#2: Line at 2 Mbit/s [kbit/s]
2000
Notes
- You're not restricted to a single source sensor, using different ID's you can use up to 50 different source sensors/channels.
- You can combine any of the above in a Sensor Factory Sensor, please see the Manual page for further syntax details.
Best regards,
Jun, 2015 - Permalink

Hello,
I'm afraid there's currently no video-tutorial on that subject. But to create a sensor that aggregates data/values from several sensors, the Sensor Factory Sensor is the solution:
Once you've added the corresponding devices and sensor's for each of the devices, you can create a Factory Sensor sensor, which can aggregate and perform calculations based on available sensor data based on a channel definition syntax.
The Channel definition will be based on the Sensor's ID (Highlighted in yellow, top-right corner) and the Channel Numbers (or ID) (center-bottom, highlighted in red) that can be seen within the source Sensor's overview:
Full-resolution Image
Examples Based on the Image Above
Subtraction of Channels
Create a Sensor Factory Sensor to display the "Free Virtual Memory" minus the "Free Physical Memory" and calling it "Channel Subtraction":
Sum of Channels
Create a Sensor Factory Sensor to display the sum of the "Free Page File Memory", "Free Physical Memory" and "Free Virtual Memory" (from the image above) and calling it "Sum of memory Channels".
Display/Combine Channels
Create a Sensor Factory Sensor to display/combine the individual channels "Health" and "CPU Load" with distinct names on a new multi-channel sensor. This is useful when you want a graph that will show you the utilization of various devices within a same channel to compare resource utilization at various servers for example.
Add a "Line" to a Graph
Create a Sensor Factory Sensor to display the total traffic from a traffic sensor but additionally display a "limit line" (useful in maps). The color and thickness of the line can be adjusted in the Channel's settings after it's creation.
Notes
Best regards,
Jun, 2015 - Permalink