At this moment I can request PRTG through the API to give me a historical graph of for example the CPU sensor. I use this call:
This gives met the combined graph of my four CPU's. What I need are four graphs for every CPU. So I was expecting an extra parameter ChannelID.
Is it possible through the API to get separate historical graphs per CPU, or in general per sensor channel?
Article Comments
Thans for your reply, however your option changes the period, not the sensor Channel.
Mar, 2016 - Permalink
Please forward us some screenshots showing the graphs with graphid= "1" and "-1".
Mar, 2016 - Permalink
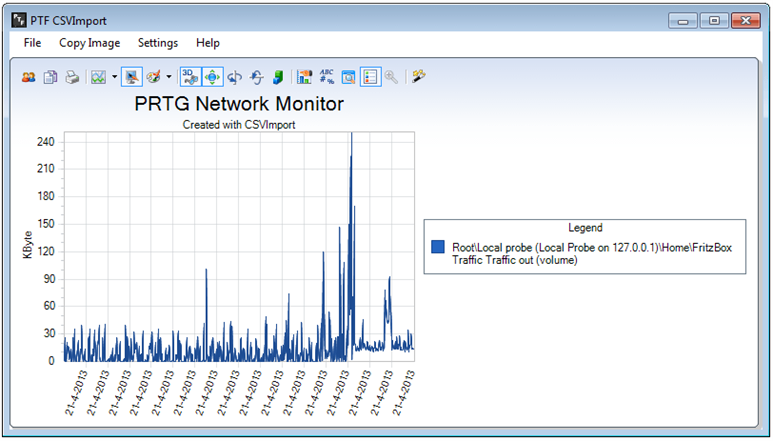
As an alternative, you might want to have a look at the CSVImport tool
CSVImport was originally intended to build graphs from data that is exported using CSVExport, but it can also build graphs using live sensor channel data directly from your PRTG server.
Mar, 2016 - Permalink
Hello Pieter,
thank you for the screenshots you can use the "&hide=" command to remove channels which are not wanted. As an example:
Processor 1 Channel ID 2 Processor 2 Channel ID 3 Total Channel ID 0
To display only the channel processor 1 use the following command: &hide=3,0
Mar, 2016 - Permalink
Thanks a lot, &hide does the trick!!
However I can not find the hide parameter in the documentation. By trying I found that hide 0 hides the total, and hide -4 hides the downtime. I think you can make people happy if this is added to the web site api documentation.
Mar, 2016 - Permalink
Hello Pieter,
Thank you for the hint.
I fowrard this request to our development team to add this to the api documentation.
Mar, 2016 - Permalink
Hello Pieter,
The channel ID's will differ per sensor type (although -4 is always the downtime) and can be found on the sensor overview page.
Mar, 2016 - Permalink

Hello,
Please try to use by graphid= "1! instead of "-1". These numbers are available: 0=live, 1=last 48 hours, 2=30 days, 3=365 days
Mar, 2016 - Permalink